


In the fast-paced and volatile world of cryptocurrency trading, making informed and strategic decisions is crucial for success. The digital currency market, known for its rapid price fluctuations, requires traders to have a strong grasp of market trends and potential future movements. This is where technical analysis comes into play, serving as an indispensable tool for traders aiming to navigate the complexities of crypto trading.
Technical analysis stands out as a methodical approach, relying on historical price data and trading volumes to forecast future price movements. Unlike fundamental analysis, which delves into the intrinsic value of an asset based on external events and financial statements, technical analysis focuses solely on price action and market behavior. This distinction is vital, as it highlights the reliance of technical analysis on patterns and trends rather than external factors.
The application of technical analysis in crypto trading is not a new phenomenon; it has been a cornerstone of traditional financial markets for decades. However, its significance has been magnified in the crypto space due to the market’s inherent volatility and liquidity. Traders proficient in technical analysis have an advantage in pinpointing optimal entry and exit points, detecting trend reversals, and forecasting market movements with greater precision.
In essence, technical analysis serves as a compass in the tumultuous sea of crypto trading, guiding traders through market fluctuations and helping them make decisions grounded in historical data and statistical probabilities. As we delve deeper into this article, we will explore the tools, patterns, and strategies that constitute technical analysis, shedding light on how traders can leverage this methodology to enhance their trading performance and make informed decisions in the dynamic world of cryptocurrency.
What is Technical Analysis?
Technical analysis is a trading discipline employed to evaluate investments and identify trading opportunities by analyzing statistical trends gathered from trading activity, such as price movement and volume. Unlike fundamental analysis, which attempts to evaluate a security’s intrinsic value based on financial and economic data, technical analysis focuses solely on the study of market actions, primarily through the use of charts.
Historical Perspective and Evolution in Crypto Trading
The roots of technical analysis can be traced back to the 17th century Japanese rice traders, but it was Charles Dow, co-founder of Dow Jones & Company, who laid down the basic principles in the late 19th century. These principles have since evolved and adapted to the modern trading world, finding a significant place in the cryptocurrency market.
In crypto trading, technical analysis has become increasingly popular due to the market’s volatile nature. Traders and investors use it to anticipate future price movements and identify potential trading opportunities. The decentralized and 24/7 nature of the crypto market makes it an ideal playground for technical analysts.
Key Principles and Assumptions Behind Technical Analysis
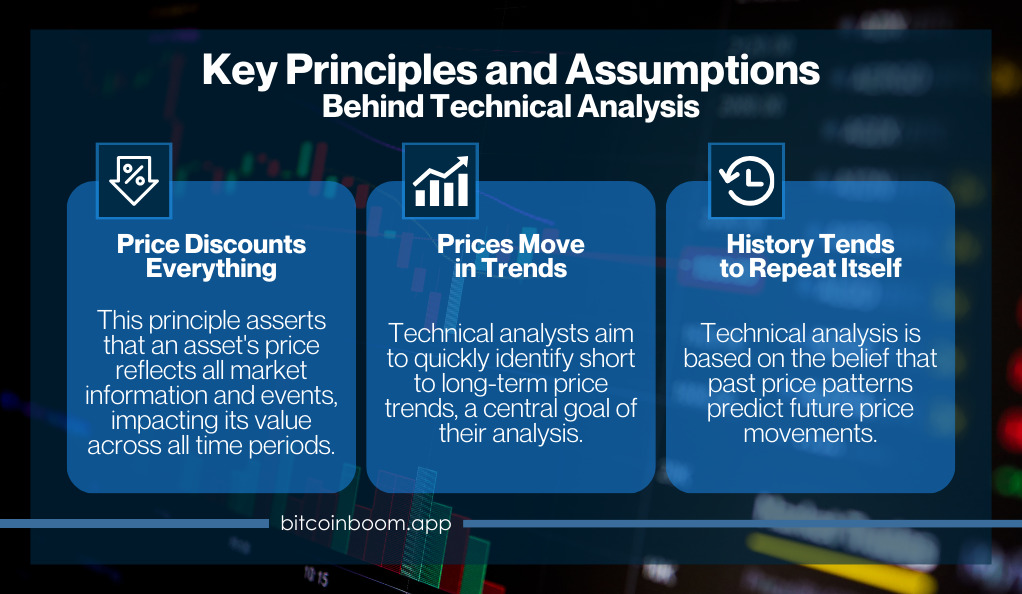
Technical analysis operates on three core principles:
- Price Discounts Everything: This principle assumes that all current market information and events are reflected in the asset’s price. Whether it’s current, historical, or upcoming events, the market price is influenced by everything.
- Prices Move in Trends: Technical analysts believe that prices move in short, medium, and long-term trends. Identifying these trends early is a key objective of technical analysis.
- History Tends to Repeat Itself: Technical analysis relies heavily on the idea that historical price movements and patterns are indicative of future price movements.
These principles guide technical analysts in their evaluation of market conditions and in making educated predictions. By understanding these foundational concepts, traders can better navigate the volatile waters of crypto trading, using historical data and patterns to make informed decisions.
Tools and Indicators Used in Technical Analysis
Technical analysis employs a variety of tools and indicators to help traders make sense of market trends and predict future movements. These tools can be broadly categorized into trend indicators, momentum indicators, volatility indicators, and volume indicators. Each category serves a unique purpose and provides different insights into market behavior.
1. Trend Indicators
Trend indicators are used to identify the direction of market movements. They help traders to spot the prevailing trend and make decisions based on its strength and direction. Some of the most commonly used trend indicators include:
- Moving Averages (MA): This indicator smoothens price data to create a single flowing line, making it easier to identify the direction of the trend. The two most common types are the Simple Moving Average (SMA) and the Exponential Moving Average (EMA).
- Moving Average Convergence Divergence (MACD): This tool is used to spot changes in the strength, direction, momentum, and duration of a trend.
2. Momentum Indicators
Momentum indicators, on the other hand, measure the speed at which prices move over a specific time period. They help traders identify overbought or oversold conditions. Popular momentum indicators include:
- Relative Strength Index (RSI): This indicator measures the magnitude of recent price changes to evaluate overbought or oversold conditions.
- Stochastic Oscillator: This tool compares a particular closing price of an asset to a range of its prices over a certain period of time.
3. Volatility Indicators
Volatility indicators show the rate at which the price of an asset increases or decreases for a given set of returns. These indicators help traders to understand the level of market activity. Examples include:
- Bollinger Bands: This tool consists of a middle band being an N-period simple moving average (SMA), an upper band at K times an N-period standard deviation above the middle band, and a lower band at K times an N-period standard deviation below the middle band.
- Average True Range (ATR): This indicator measures market volatility by decomposing the entire range of an asset price for that period.
4. Volume Indicators
Volume indicators are used to understand the strength of price movements. High volume, especially near important market levels, suggests a possible start of a new trend, while low volume suggests a lack of interest in the given market. Some of the key volume indicators include:
- On-Balance Volume (OBV): This tool uses volume flow to predict changes in stock price.
- Chaikin Money Flow (CMF): This indicator combines price and volume to view the flow of money in or out of a stock over a specific period.
By mastering these tools and indicators, traders can enhance their ability to make informed trading decisions, ultimately leading to more successful trading outcomes.
Chart Patterns and Analysis
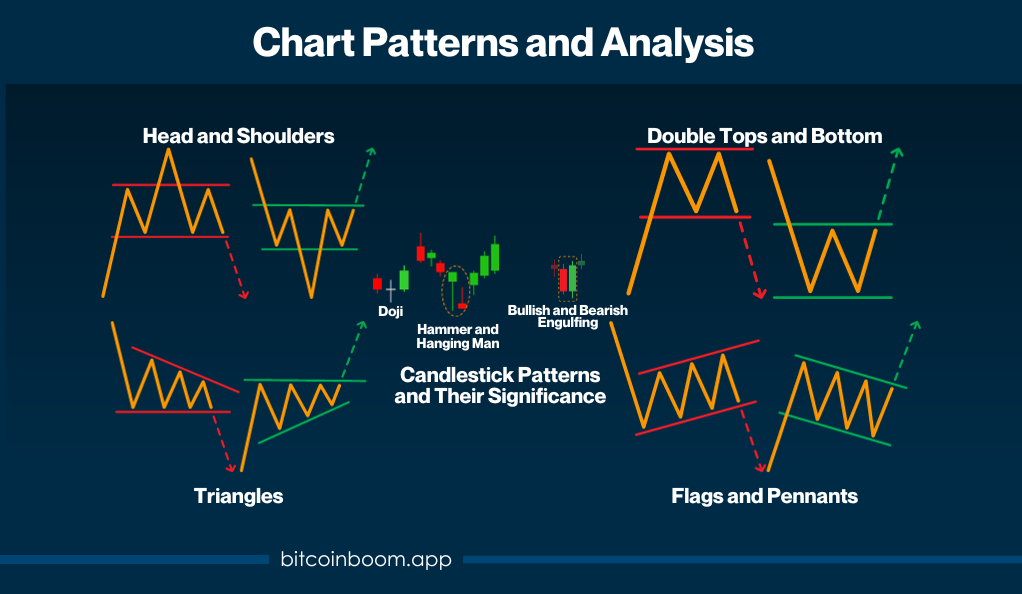
Chart patterns play a crucial role in technical analysis, helping traders to visualize price movements and identify potential trends and reversals. Recognizing these patterns can provide valuable insights, guiding traders in making informed decisions. Below are some of the most common chart patterns and their implications.
- Head and Shoulders: The Head and Shoulders pattern is one of the most reliable trend reversal patterns. It consists of three peaks: the middle peak (head) is the highest, while the two outer peaks (shoulders) are lower and roughly equal. The appearance of this pattern signals the end of an uptrend and the beginning of a downtrend.
- Double Tops and Bottoms: This pattern is another trend reversal indicator. A Double Top occurs after an uptrend and indicates a movement towards a downtrend. It is characterized by two peaks at roughly the same price level. Conversely, a Double Bottom occurs after a downtrend and signals a shift towards an uptrend, marked by two troughs at a similar price level.
- Triangles: Triangles are continuation patterns that can signal either consolidation or reversal. They are categorized into three types: ascending, descending, and symmetrical. Ascending triangles are bullish and form during an uptrend, while descending triangles are bearish and form during a downtrend. Symmetrical triangles can signal either a bullish or bearish scenario depending on the prevailing trend.
- Flags and Pennants: These short-term continuation patterns represent brief consolidations before the previous move resumes. Flags are rectangular shaped and slope against the prevailing trend, while pennants are small symmetrical triangles that form after a strong price movement.
- Candlestick Patterns and Their Significance: Candlestick patterns, originating from Japan over 100 years ago, are another vital aspect of chart analysis. These patterns provide insights into market sentiment and potential reversals. Here are a few key candlestick patterns:
- Doji: Indicates indecision in the market, showing that neither buyers nor sellers have control.
- Hammer and Hanging Man: The Hammer is a bullish reversal pattern formed during a downtrend, while the Hanging Man is a bearish reversal pattern formed during an uptrend.
- Bullish and Bearish Engulfing: These patterns indicate a potential reversal in the market. A Bullish Engulfing pattern occurs at the end of a downtrend, while a Bearish Engulfing pattern occurs at the end of an uptrend.
Risk Management in Technical Analysis
In the volatile realm of cryptocurrency trading, effective risk management is paramount. Even with the most accurate technical analysis, the unpredictable nature of the market can lead to unexpected outcomes. Therefore, it is crucial for traders to implement sound risk management strategies to protect their investments.
1. Setting Stop-Loss and Take-Profit Orders
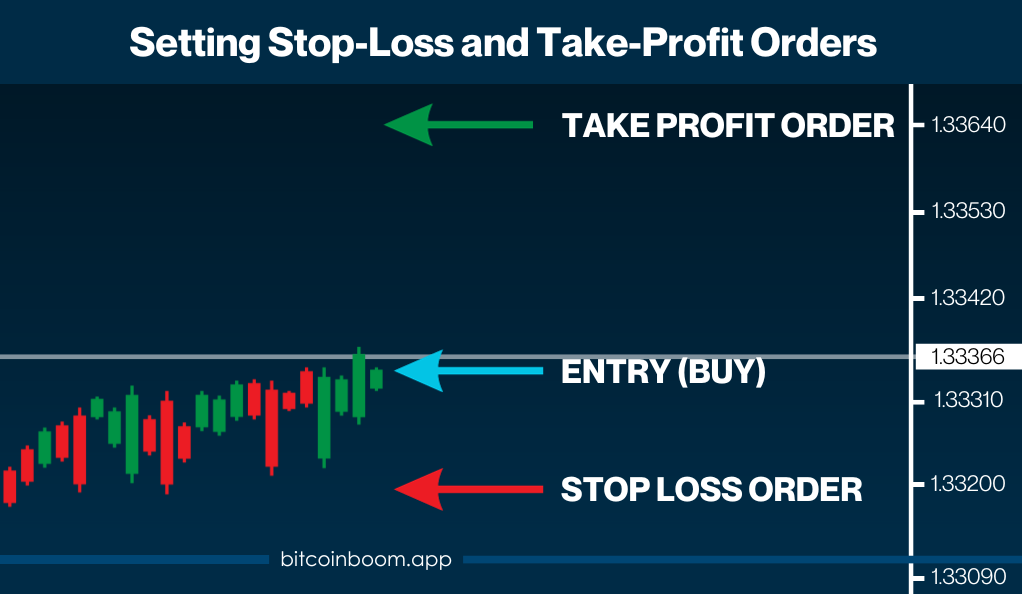
One of the fundamental aspects of risk management is the use of stop-loss and take-profit orders. A stop-loss order automatically closes a position at a predetermined price level, limiting potential losses. Conversely, a take-profit order secures profits by closing a position once the asset price reaches a certain level.
- Stop-Loss Orders: These orders are crucial for preventing significant losses in the event of sudden market downturns. Traders should set stop-loss orders based on technical indicators and support/resistance levels, rather than emotions.
- Take-Profit Orders: These orders help in securing profits before the market can reverse. Like stop-loss orders, take-profit orders should be set based on technical analysis and realistic profit targets.
2. Risk-Reward Ratio
The risk-reward ratio is another vital component of risk management. It represents the potential risk in a trade compared to its potential reward. A favorable risk-reward ratio, such as 1:3, indicates that the potential reward is three times the potential risk. Traders should always aim for trades with a favorable risk-reward ratio to ensure long-term profitability.
3. Diversification
Diversification involves spreading investments across different assets or markets to reduce exposure to any single asset or risk. In crypto trading, this could mean investing in a variety of cryptocurrencies rather than putting all capital into one. Diversification helps in mitigating risks and reducing the impact of adverse market movements.
4. Position Sizing
Proper position sizing ensures that traders do not invest more than they can afford to lose on a single trade. It involves determining the size of a position based on the trader’s risk tolerance and the stop-loss level. This practice is crucial in preventing substantial losses and protecting the trading capital.
Common Mistakes and Misconceptions in Technical Analysis
Technical analysis is a powerful tool for traders, but it is not without its challenges. Misinterpretations and common mistakes can lead to incorrect trading decisions. Here, we address some of these issues and provide guidance on how to avoid them.
- Overreliance on Indicator: One of the most common mistakes in technical analysis is the overreliance on indicators. While indicators are valuable tools, they are not foolproof and should not be used in isolation. Traders should use them in conjunction with other forms of analysis and market knowledge to make informed decisions.
- Ignoring Market News: Another misconception is that technical analysis alone is sufficient for successful trading. However, ignoring market news and global events can be detrimental. These factors can have a significant impact on asset prices, and traders should be aware of them to avoid unexpected market movements.
- Lack of a Trading Plan: A well-thought-out trading plan is essential for success. Some traders, especially beginners, may neglect this and trade based on emotions or gut feelings. A trading plan should include clear entry and exit criteria, risk management strategies, and profit targets.
- Chasing Trends: Jumping into a trend late, or “chasing” it, can lead to substantial losses. Traders should aim to identify trends early through technical analysis and enter trades at optimal points. Entering a trade too late increases the risk and reduces the potential reward.
- Neglecting Risk Management: As discussed in the previous section, risk management is crucial. Neglecting to set stop-loss orders or investing too much capital in a single trade can lead to significant losses. Traders should always adhere to sound risk management practices.
- Confirmation Bias: Confirmation bias occurs when traders seek out information that confirms their existing beliefs and ignore information that contradicts them. This bias can lead to skewed analysis and poor trading decisions. Traders should strive to remain objective and consider all available information.
The Future of Technical Analysis in Crypto Trading
As the cryptocurrency market continues to evolve, so does the field of technical analysis. Emerging trends and technologies are shaping the future of trading, and traders who adapt to these changes will be better positioned to succeed.
Integration of Machine Learning and Artificial Intelligence
Machine learning and artificial intelligence (AI) are becoming increasingly prevalent in technical analysis. These technologies can analyze vast amounts of data at incredible speeds, identifying patterns and trends that might be imperceptible to the human eye. Traders are leveraging these tools to enhance their analysis and make more accurate predictions.
Algorithmic Trading
Algorithmic trading, which involves the use of algorithms to execute trades based on predefined criteria, is becoming more common in the crypto space. These algorithms can incorporate technical analysis, allowing for faster and more efficient trading. However, traders should be cautious and ensure they understand the algorithms they are using, as there are risks involved.
Increased Accessibility of Data and Tools
The availability of trading tools and data is increasing, making technical analysis more accessible to the average trader. This democratization of information is empowering traders, providing them with the resources they need to make informed decisions.
The Importance of Continuous Learning
The field of technical analysis is constantly evolving, and traders must commit to continuous learning to keep up with the latest trends and tools. This involves staying updated on market news, exploring new analysis techniques, and being open to adapting trading strategies as needed.
Conclusion
Technical analysis stands as a cornerstone in cryptocurrency trading, providing traders with invaluable tools and insights to navigate the market’s volatility. By mastering chart patterns, employing a variety of technical indicators, and integrating sound risk management practices, traders can make more informed decisions, enhancing their potential for success. This discipline stands firmly on historical data and statistical probabilities, providing a systematic method for navigating the unpredictable terrain of cryptocurrency trading.
However, it is crucial for traders to remember that technical analysis, while powerful, is not infallible. The crypto markets are notorious for their swift fluctuations and unexpected events, demanding constant learning and flexibility as crucial elements for successful trading. Traders must stay updated, uphold discipline, and readily adapt their strategies to the ever-changing market. In doing so, they can effectively employ technical analysis as an essential tool in their trading arsenal, aiming to meet their trading goals within the volatile realm of cryptocurrency trading.